- Home
- News & Analysis
- Trading Strategies, Psychology
- Trend retracement or reversal? – Can volume be a useful “clue”?
Trend retracement or reversal? – Can volume be a useful “clue”?
December 26, 2019
Trading Volume: General principles
Many experienced traders (even those using a simple system will incorporate volume as part of their entry (common) and/or exit (less common) system.
It is essential (as with any indicator) that you understand the role volume can and cannot play with suggestions of what is happening to market sentiment. So generally speaking, trading volume may offer some guidance as to whether market participants are changing sentiment towards the pricing of an asset, and if there is a price move, whether it may have a higher probability in continuing in that trend direction.
Many would consider it more “leading” than the majority of other indicators. Indeed, VSA (volume Spread Analysis) which is based on this principle is an approach used by many.
In simple terms, a price move (either way) with higher traded volume is thought to be more robust in terms of trend continuation.
Whereas Lower volume with a price suggests market uncertainty or no interest.
Trend reversal and retracement
A trend reversal is, as the name suggests, sentiment moving from an established upwards trend to, a new trend forming in the opposite direction e.g. upwards to downwards trend (or visa versa). The risk of remaining in a trade that is reversing is loss of potential profit in that position if one delays exit.
A trend retracement, is a temporary pull back in price prior to continuation of that change in the same direction, often termed a trend pause). The risk of exiting a trade on a retracement is that you are missing out of the additional profit from a subsequent trend continuation move.
This differentiation is important when the trader is considering an exit from a specific position. For example, recognition a reversal from a uptrend to downtrend early would be beneficial when in a long trade. Whereas should the price move be a retracement then to continue to hold that position may prove to have a better outcome as the price subsequently moves higher.
The challenge, of course, Is that ability to differentiate and identify through the use of technical “clues” what may be happening to market sentiment.
Is volume the “clue”?
If one accepts the premise that level of volume is an indicator in terms of the potential strength of a price move, then can this be a “clue” as to whether the more likely outcome is reversal or retracement?
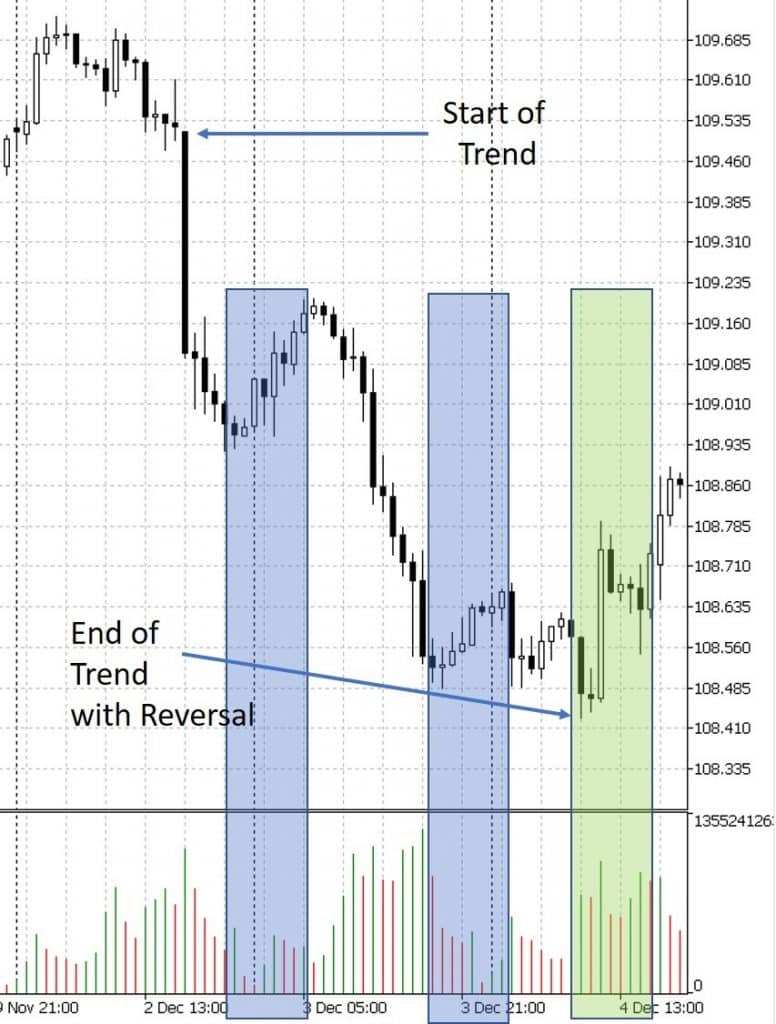
See below for an hourly chart of USDJPY. We have labelled the confirmed start of trend after a double top type of chart pattern through to the end of the trend and subsequent reversal.
Note the lower volume of the two retracements (shown in blue highlight) and the subsequent higher volume as the trend ultimately reversed.
In terms of trading actions logically one could consider the following:
• Retracements may be a signal to trail a stop loss to the base of the retracement.
• Increasing volume may be a signal to exit directly in anticipation of a confirmed reversal.
The Forex Volume Challenge?
As many readers will be trading Forex it would remiss of us not to discuss the specific issue briefly with the volume seen on an MT4 platform.
With shares (and the volume shown on Share CFD charts for example), the number of traded positions is managed and reported by the central exchanges (e.g. ASX, NYSE).
However, with FX there is no central exchange so the volume you see reflects the trades going through relevant liquidity providers. Additionally, Forex volume on MT4 measures a record of ticks rather than the number of lots traded. One tick measures a single price change. As a price moves up and down this “tick volume” alters within the specific chart period.
On the MT5 platform there is a option to choose so called “real volume” and yet it should still be borne in mind that compared to a stock exchange which theoretically shows all trades from the whole exchange this is not the case with Forex.
Hence, some may question as to whether the measured chart volume with Forex is sufficiently valid on which to make decisions (although theoretically the principle remains the same).
The reality…
Whatever your thoughts on this, arguably you could question the validity of any indicator. So, ultimately you use the same process for testing and subsequently potentially adding any indicator you may be considering the use of in your individual decision making i.e. back-test to justify a forward test and on evidence decide whether, and how to add volume to your trading decisions.
You challenge is to do the testing, and plant your flag as to whether you are to utilise this in your trading.
Mike Smith
Educator
GO Markets
Disclaimer
The article from GO Markets analysts is based on their independent analysis. Views expressed are of their own and of a ‘general’ nature. Advice (if any) are not based on the reader’s personal objectives, financial situation or needs. Readers should, therefore, consider how appropriate the advice (if any) is to their objectives, financial situation and needs, before acting on the advice.
Next: 3 potential reasons why forward testing a new strategy is beneficial when amending trading plan
Previous: Trading plan specifics – Articulating your trail stop strategy in your plan


